Background
Survey Junkie is a mobile and desktop app that connects users with market research surveys, letting them earn money for sharing their opinions. The platform has always looked transactional on the surface: take a survey, get paid. But we suspected there was a deeper narrative behind why 2.5 million monthly active users kept coming back.
At the start of 2022, we surveyed our Members to understand their motivations, preferences, and strategies for taking surveys. A clear trend emerged from the thousands of responses: many Members used Survey Junkie with specific savings goals in mind, leveraging the platform to cover essentials like utility bills, holiday gifts, or a "fun money" fund.
Hypothesis 1
Hypothesis: this discovery led to our first bet: introducing a feature that lets Members set and track goals within Survey Junkie would create a more personalized experience, making the app a more integral part of Members' daily routines and boosting both retention and engagement.
Test: we built a Smoke Test with minimal functionality to gauge interest without burning real development time. We ran a four-week A/B test across 100% of our iOS app users. Cohort A (control) never saw the goal-setting feature; Cohort B was introduced to it right after completing their first survey.
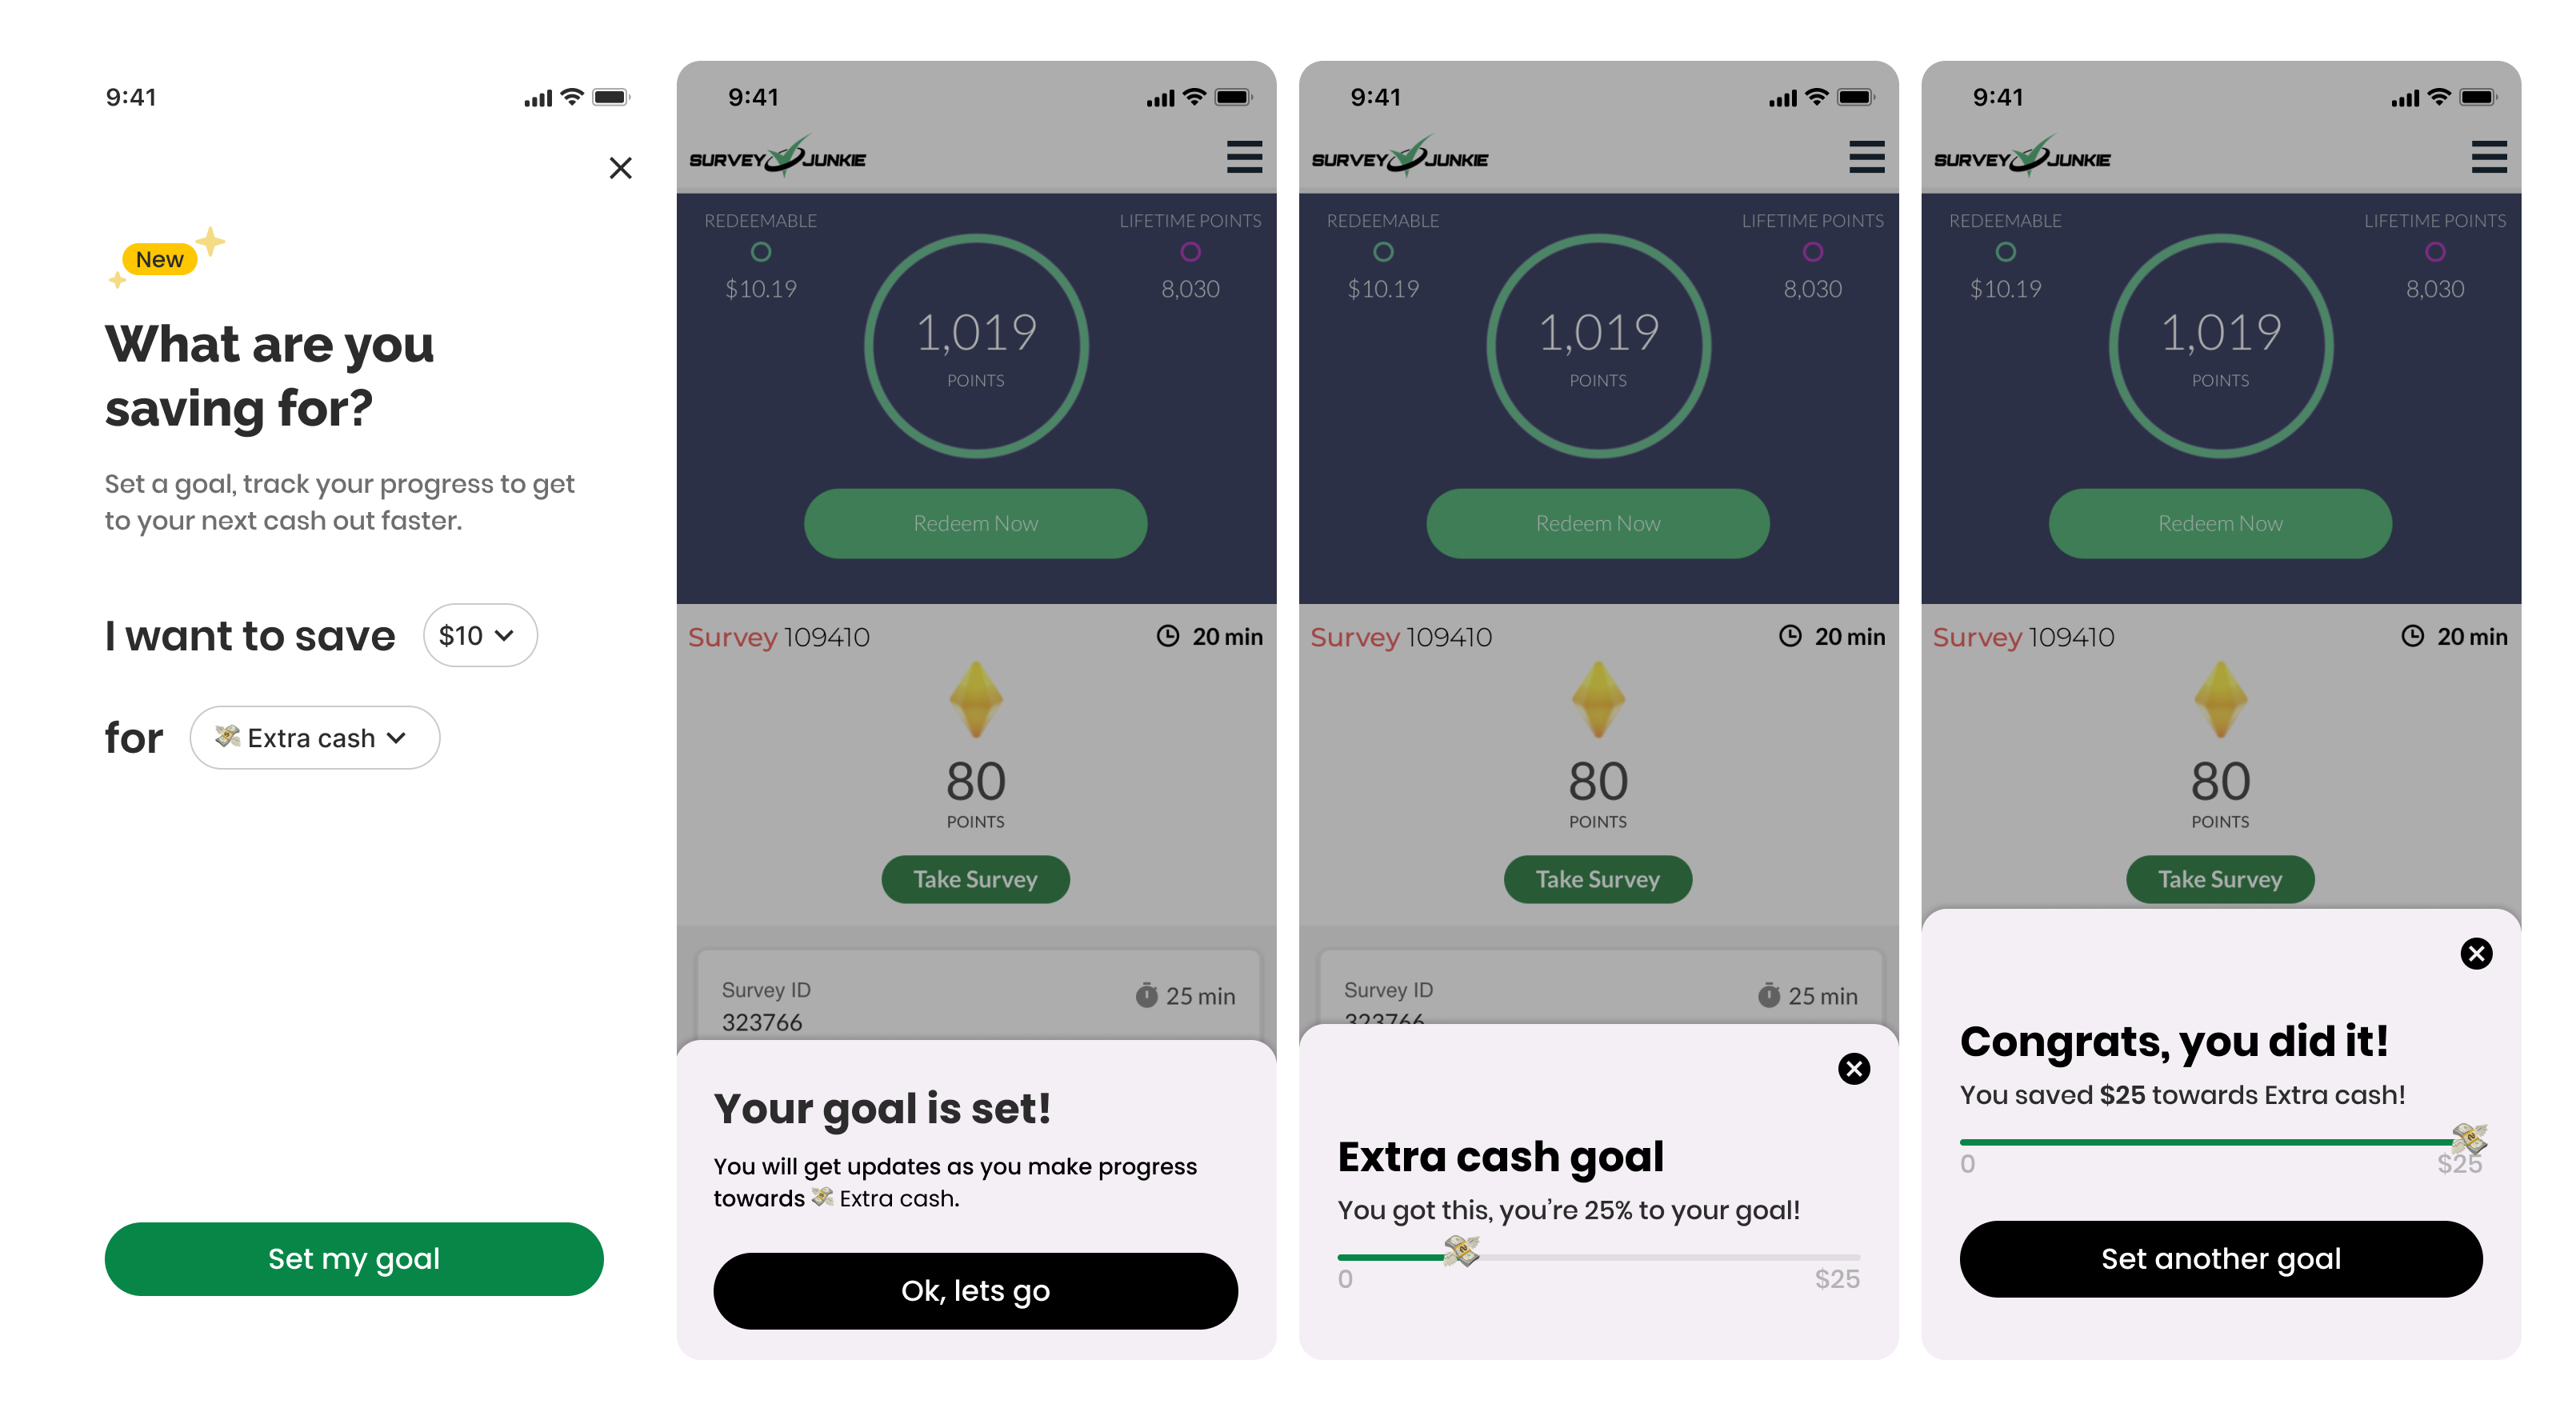
Results: the numbers came in loud and clear. 68.5% of Members in Cohort B set a goal, and that group also showed higher engagement: 9% more survey clicks per Member and 17% more unique redemptions than the control group. By the metrics of our Smoke Test, that's a win. But looking further down the funnel told a more complicated story.
68.5% of Members in the test group set a goal
Only 3.7% of Members who set a goal actually achieved it within the four-week window. Retention in Cohort B dropped 7% at five days and 26% at 14 days. Digging in, we found 33% of Members were setting ambitious $30 goals, which could take weeks for a casual user to reach. Compounding the problem, progress reminders only fired at 25%, 50%, 75%, and 100% completion, meaning some Members might never see a tracking prompt at all. Those findings shaped our next hypothesis.
Hypothesis 2
Hypothesis: we suspected Members felt frustrated when they didn't see consistent progress toward their goals. By introducing static goal tracking at key reward moments, like right after completing a survey, and giving progress an animated visual, we could make it tangible: reduce frustration and keep Members engaged by clearly showcasing what they'd already achieved.
Test: we kept the same goal-setup flow from the Smoke Test but layered in static goal tracking on the Rewards page and on survey-completion screens, where Members actually earn points. Same 100% iOS audience, same 50/50 split.
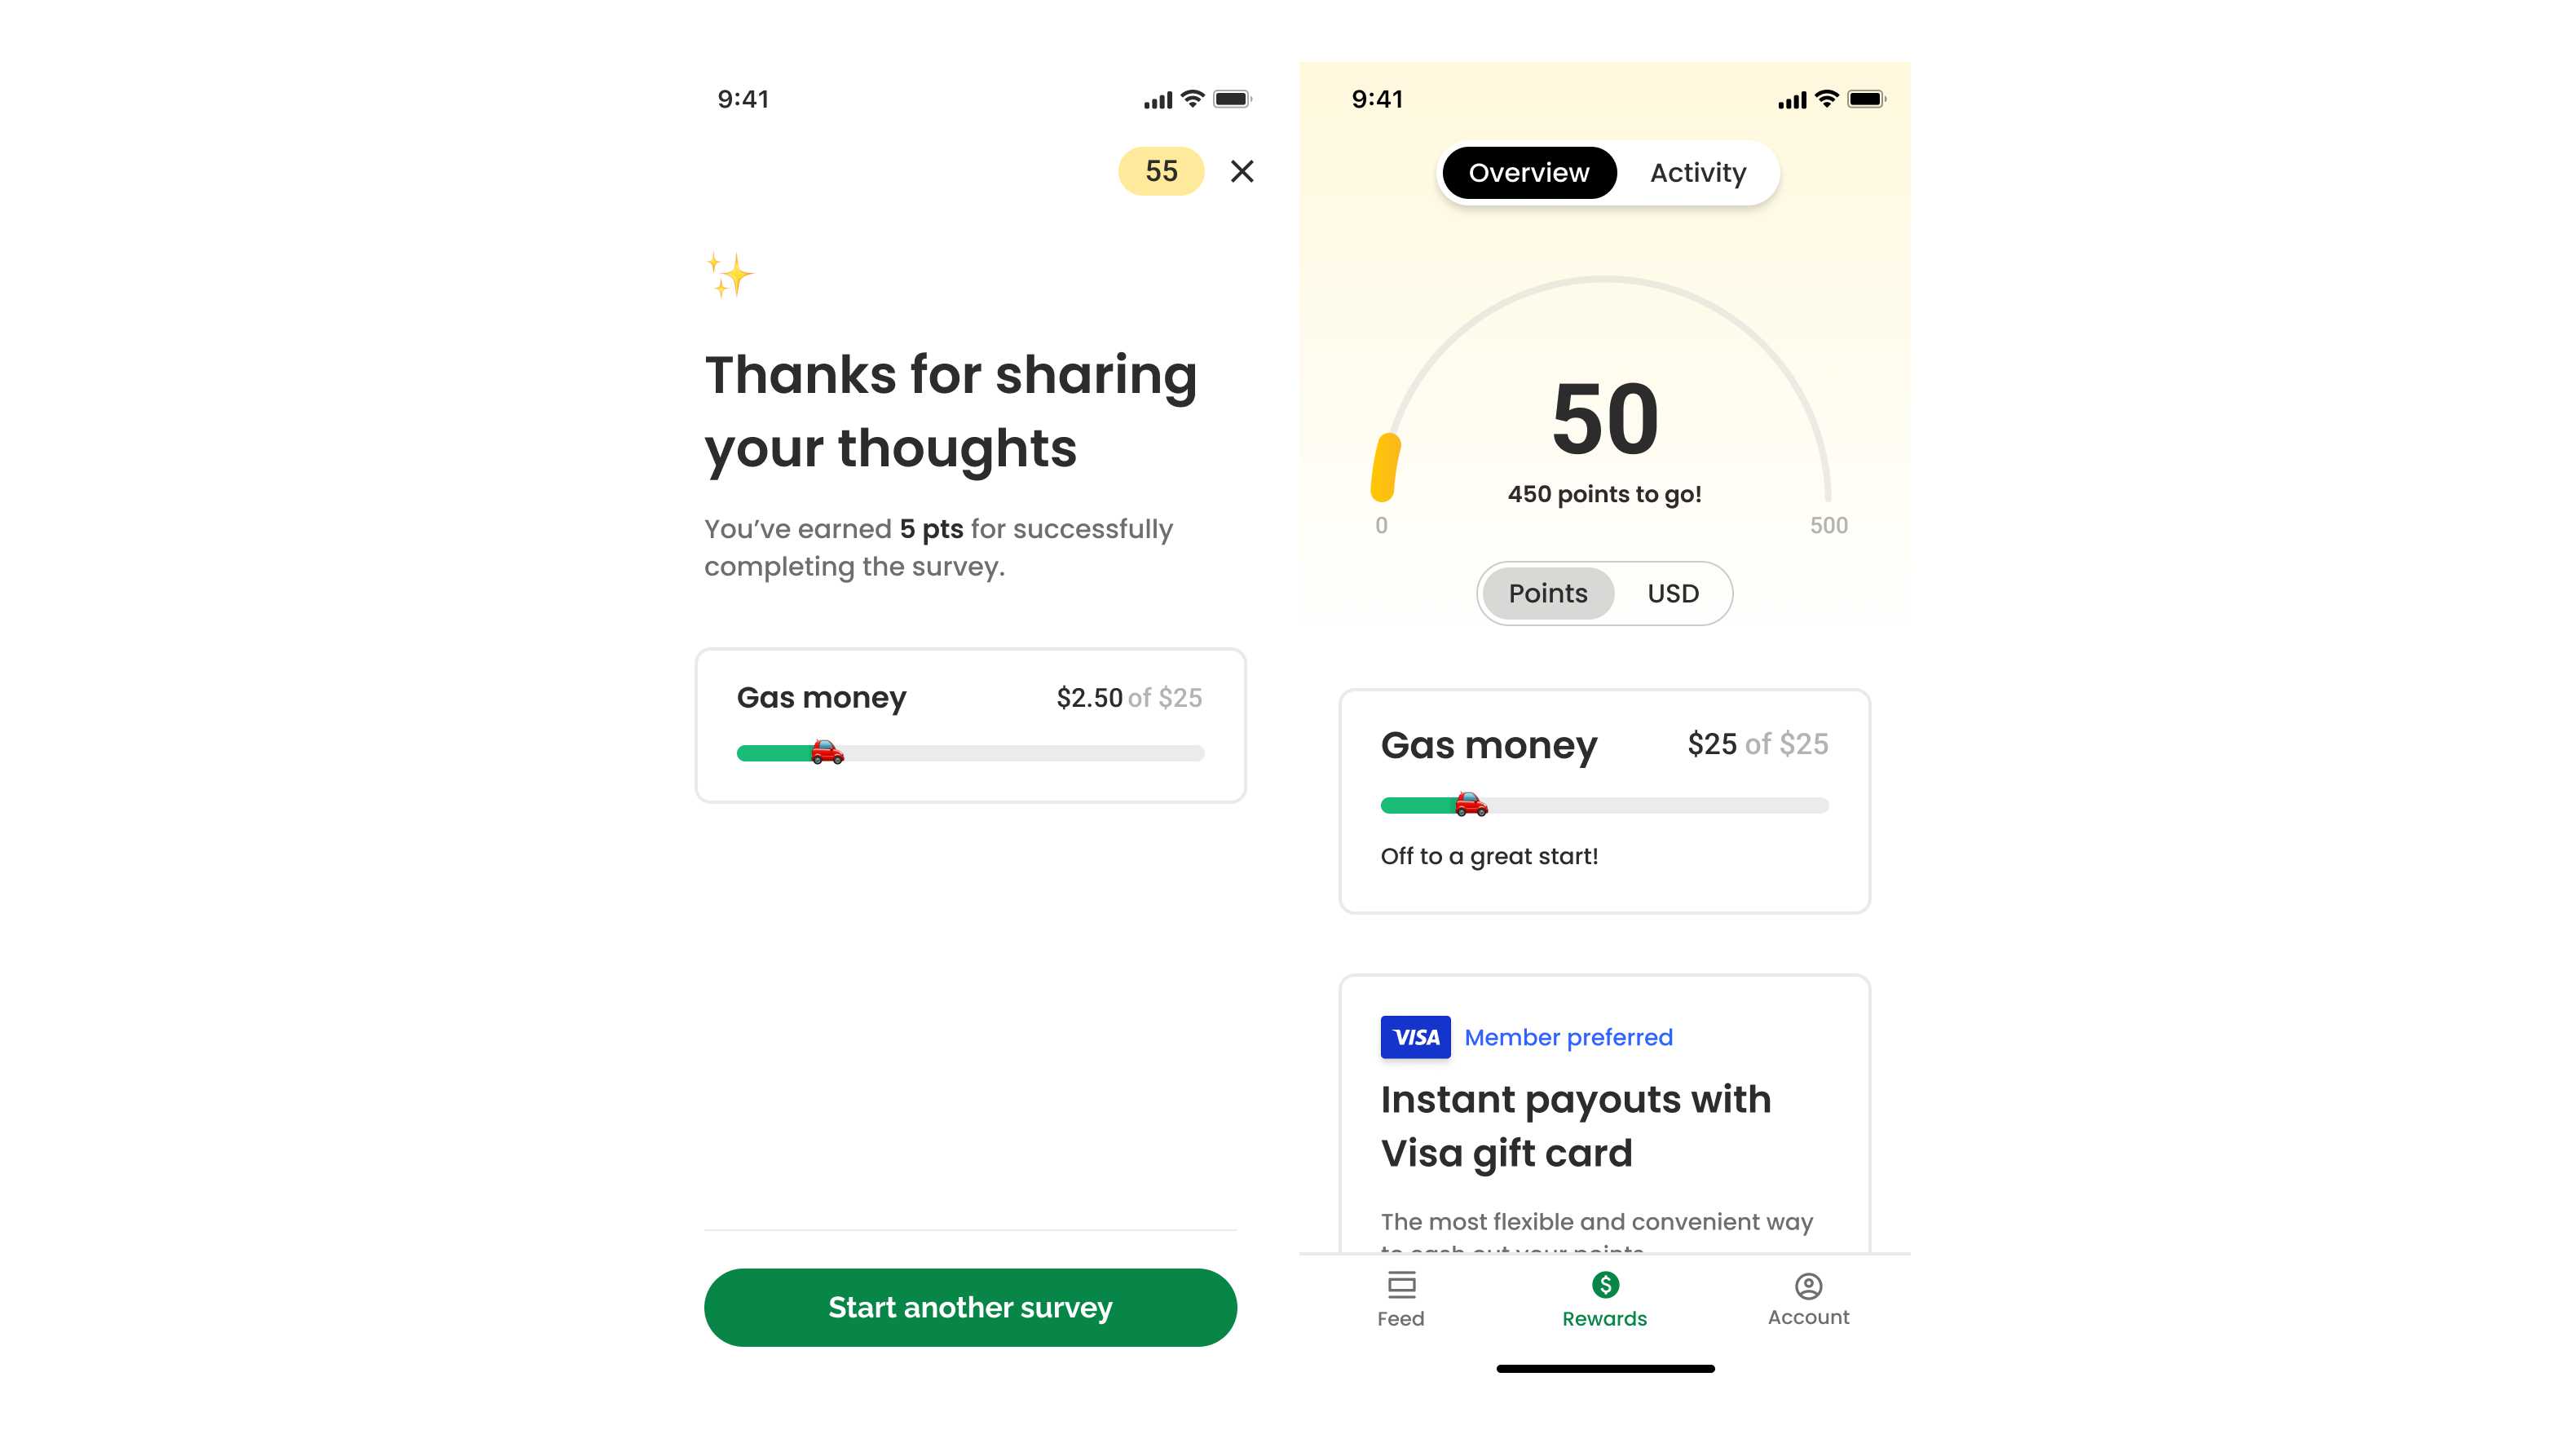
Results: this time, the added touchpoints made a real difference. Goal-setting held steady at 65%, but the payoff showed up in the goal-achievement metrics that mattered: 54% of Members who set goals successfully reached them, and 14-day retention jumped 20%. Members felt a genuine sense of accomplishment working toward the things that mattered to them.
Conclusion
Hypothesis-driven development proved to be one of the most effective ways to de-risk our work in real time. By testing our assumptions early through well-structured experiments, we gathered actionable insight that directly shaped our product decisions, validated ideas quickly, adjusted course when we needed to, and made sure what we shipped actually met our Members' needs. It reinforced something we already believed: continuous testing and learning make for a more engaging, more personal product, while minimizing the risk of pouring resources into unproven concepts.